7.9 Spatial cropping
If the region of interest is smaller than the spatial extent of the stars raster data, then there is no need to carry around the irrelevant part of the stars. In such a case, you can crop the stars to the region of interest using st_crop(). The general syntax of st_crop() is
You can use an sfc or bbox objects in place of an sf object.
For demonstration, we use PRISM tmax data for the U.S. for January 2019 as a stars object.
(
tmax_m8_y09_stars <- read_stars("./Data/PRISM_tmax_y2009_m8.tif") %>%
  setNames("tmax") %>%
  filter(band <= 10) %>%
  st_set_dimensions(
    "band",
    values = seq(ymd("2009-01-01"), ymd("2009-01-10"), by = "days"),
    name = "date"
  )
)
stars object with 3 dimensions and 1 attribute
attribute(s), summary of first 1e+05 cells:
tmax
Min. :15.08
1st Qu.:20.18
Median :22.58
Mean :23.87
3rd Qu.:26.33
Max. :41.25
NA's :60401
dimension(s):
from to offset delta refsys point values
x 1 1405 -125.021 0.0416667 NAD83 FALSE NULL [x]
y 1 621 49.9375 -0.0416667 NAD83 FALSE NULL [y]
date 1 10 2009-01-01 1 days Date NA NULL The region of interest is Michigan.
MI_county_sf <- st_as_sf(maps::map("county", "michigan", plot = FALSE, fill = TRUE)) %>%
  #--- transform using the CRS of the PRISM stars data  ---#
  st_transform(st_crs(tmax_m8_y09_stars))
We can crop the tmax data to the Michigan state border using st_crop() as follows:
stars object with 3 dimensions and 1 attribute
attribute(s):
     tmax
 Min.   :16.02
 1st Qu.:22.54
 Median :24.38
 Mean   :24.67
 3rd Qu.:26.23
 Max.   :35.37
 NA's   :172350
dimension(s):
     from   to     offset      delta refsys point values
x     831 1022   -125.021  0.0416667  NAD83 FALSE   NULL [x]
y      59  198    49.9375 -0.0416667  NAD83 FALSE   NULL [y]
date    1   10 2009-01-01     1 days   Date    NA   NULL
Notice that from and to for x and y have changed to cover only the boundary box of the Michigan state border. Note that the values for the cells outside of the Michigan state border were set to NA. The following plot clearly shows the cropping was successful.
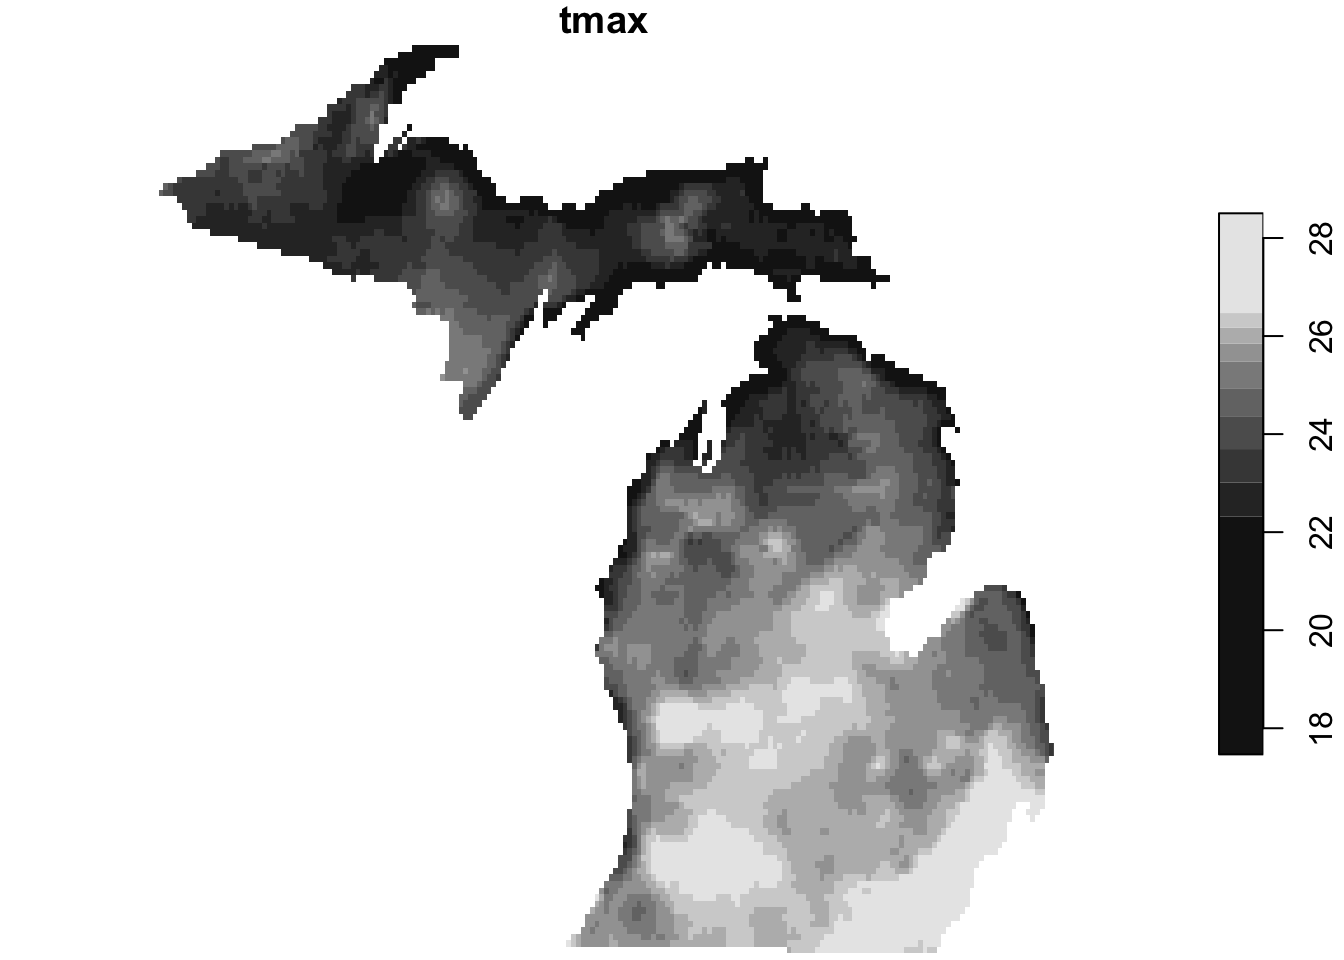
Figure 7.7: PRISM tmax data cropped to the Michigan state border
Alternatively, you could use [] like as follows to crop a stars object.
stars object with 3 dimensions and 1 attribute
attribute(s):
     tmax
 Min.   :16.02
 1st Qu.:22.54
 Median :24.38
 Mean   :24.67
 3rd Qu.:26.23
 Max.   :35.37
 NA's   :172350
dimension(s):
     from   to     offset      delta refsys point values
x     831 1022   -125.021  0.0416667  NAD83 FALSE   NULL [x]
y      59  198    49.9375 -0.0416667  NAD83 FALSE   NULL [y]
date    1   10 2009-01-01     1 days   Date    NA   NULL