7.3 Quick visualization for exploration
You can use plot() to have a quick static map and mapview() or the tmap package for interactive views.
7.3.1 quick static map
plot(prcp_tmax_PRISM_m8_y09["tmax",,,])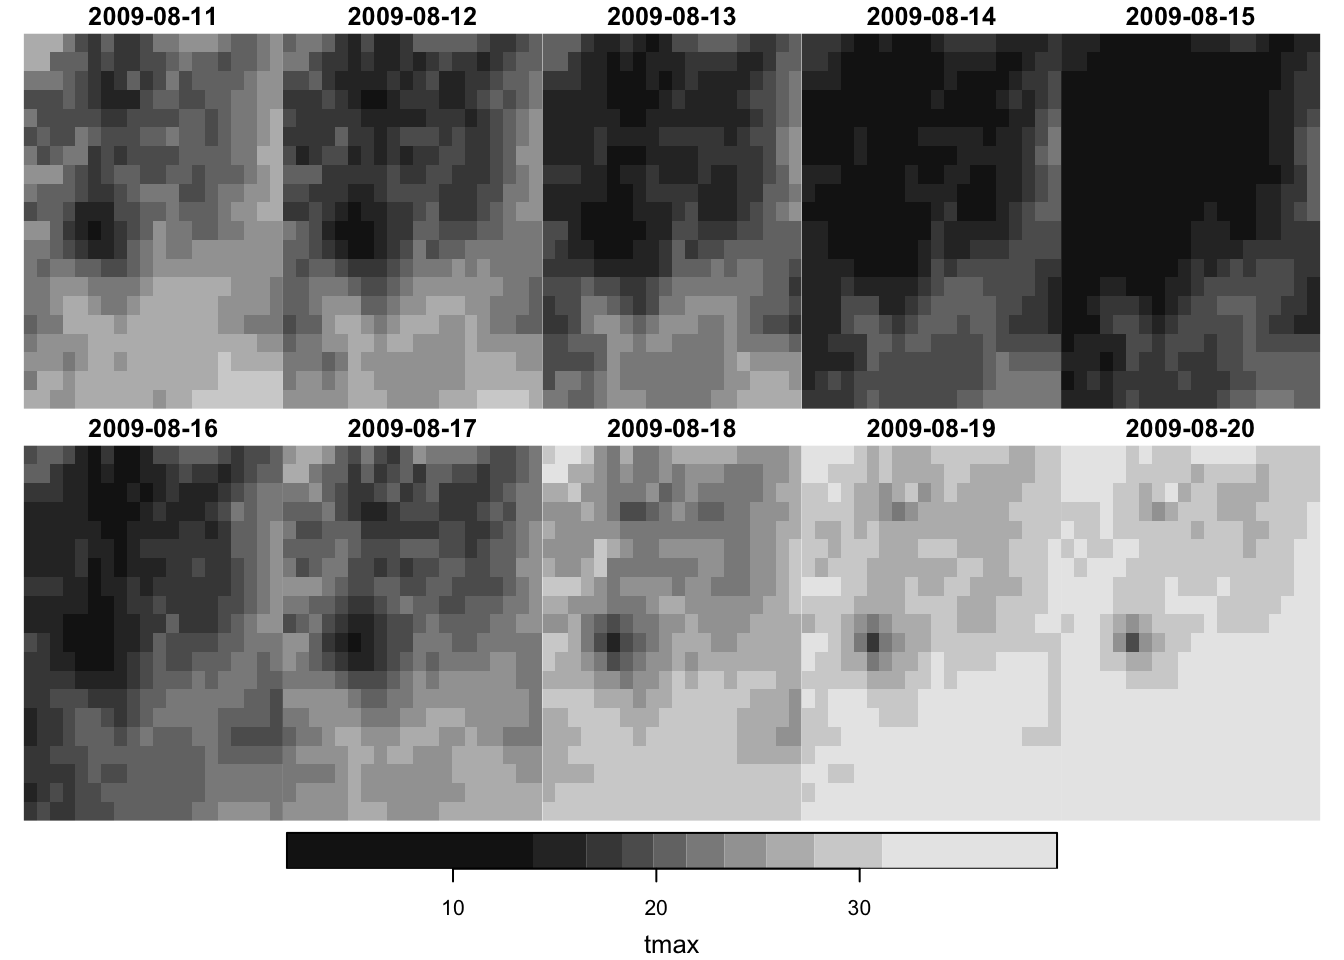
It only plots the first attribute if the stars object has multiple attributes:
plot(prcp_tmax_PRISM_m8_y09)
, which is identical with this:
plot(prcp_tmax_PRISM_m8_y09["ppt",,,])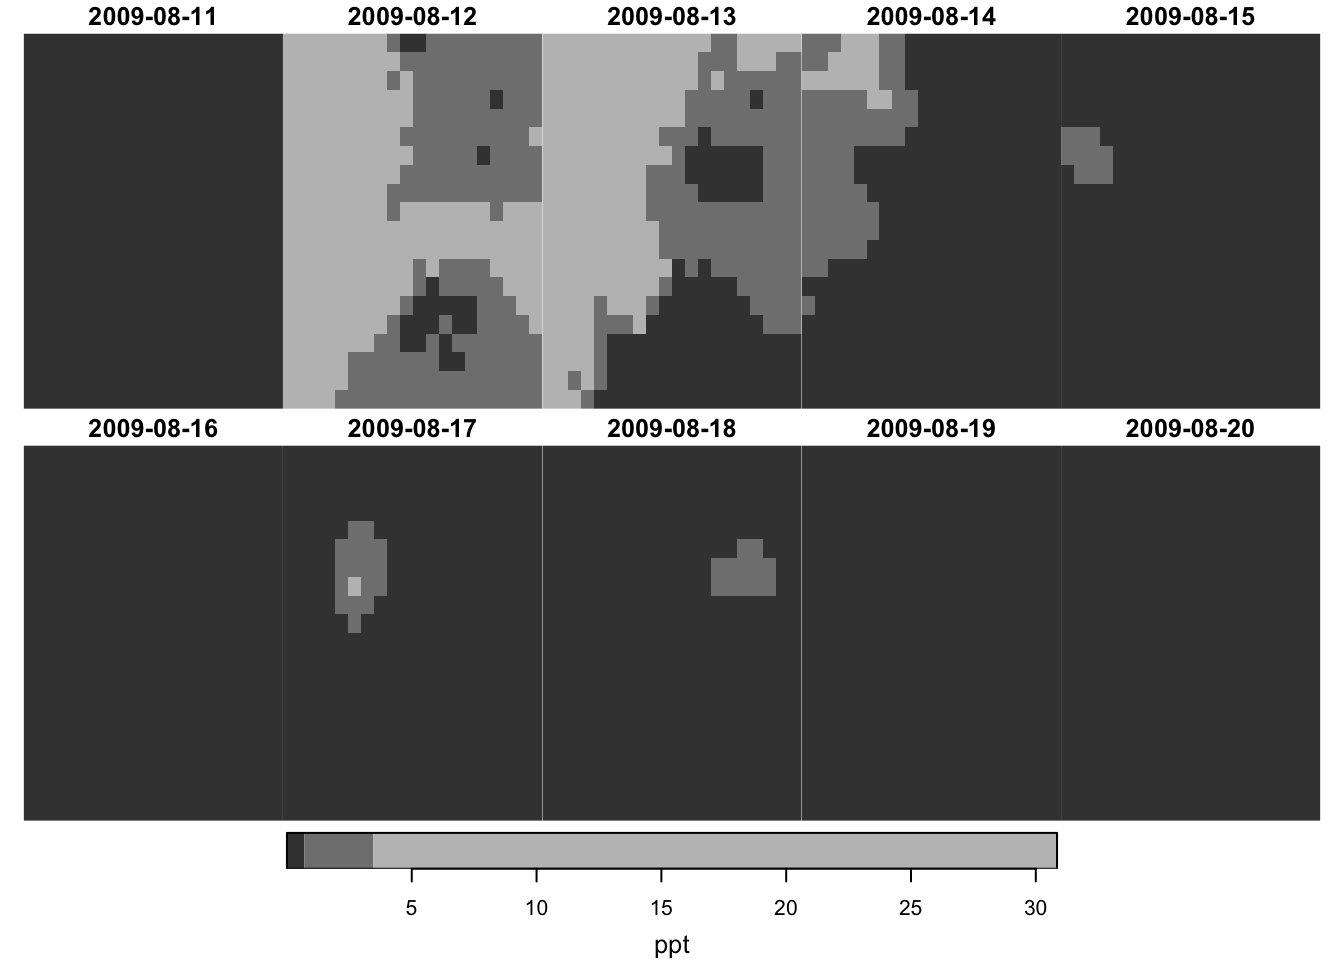
7.3.2 interactive map
You can use the tmap package. You can apply tmap_leaflet() to a static tmap object to make it an interactive map. The tm_facets(as.layers = TRUE) option stacks all the layers in a single map.
#--- make it interactive ---#
tmap_leaflet(
  tm_shape(prcp_tmax_PRISM_m8_y09["tmax",,,]) +
  tm_raster() +
  tm_facets(as.layers = TRUE)
)