7.1 Understanding the structure of a stars object
Let’s import a stars object of daily PRISM precipitation and tmax saved as an R dataset.
#--- read PRISM prcp and tmax data  ---#
(
prcp_tmax_PRISM_m8_y09 <- readRDS("Data/prcp_tmax_PRISM_m8_y09_small.rds")
)
stars object with 3 dimensions and 2 attributes
attribute(s):
Min. 1st Qu. Median Mean 3rd Qu. Max.
ppt 0.000 0.00000 0.000 1.292334 0.01100 30.851
tmax 1.833 17.55575 21.483 22.035435 26.54275 39.707
dimension(s):
from to offset delta refsys point values x/y
x 1 20 -121.729 0.0416667 NAD83 FALSE NULL [x]
y 1 20 46.6458 -0.0416667 NAD83 FALSE NULL [y]
date 1 10 2009-08-11 1 days Date NA NULL This stars object has two attributes: ppt (precipitation) and tmax (maximum temperature). They are like variables in a regular data.frame. They hold information we are interested in using for our analysis.
This stars object has three dimensions: x (longitude), y (latitude), and date. Each dimension has from, to, offset, delta, refsys, point, and values. Here are their definitions (except point79):
from: beginning indexto: ending indexoffset: starting valuedelta: step valuerefsys: GCS or CRS forxandy(and can beDatefor a date dimension)values: values of the dimension when objects are not regular
In order to understand the dimensions of stars objects, let’s first take a look at the figure below (Figure 7.1), which visualizes the tmax values on the 2D x-y surfaces of the stars objects at 10th date value (the spatial distribution of tmax at a particular date).
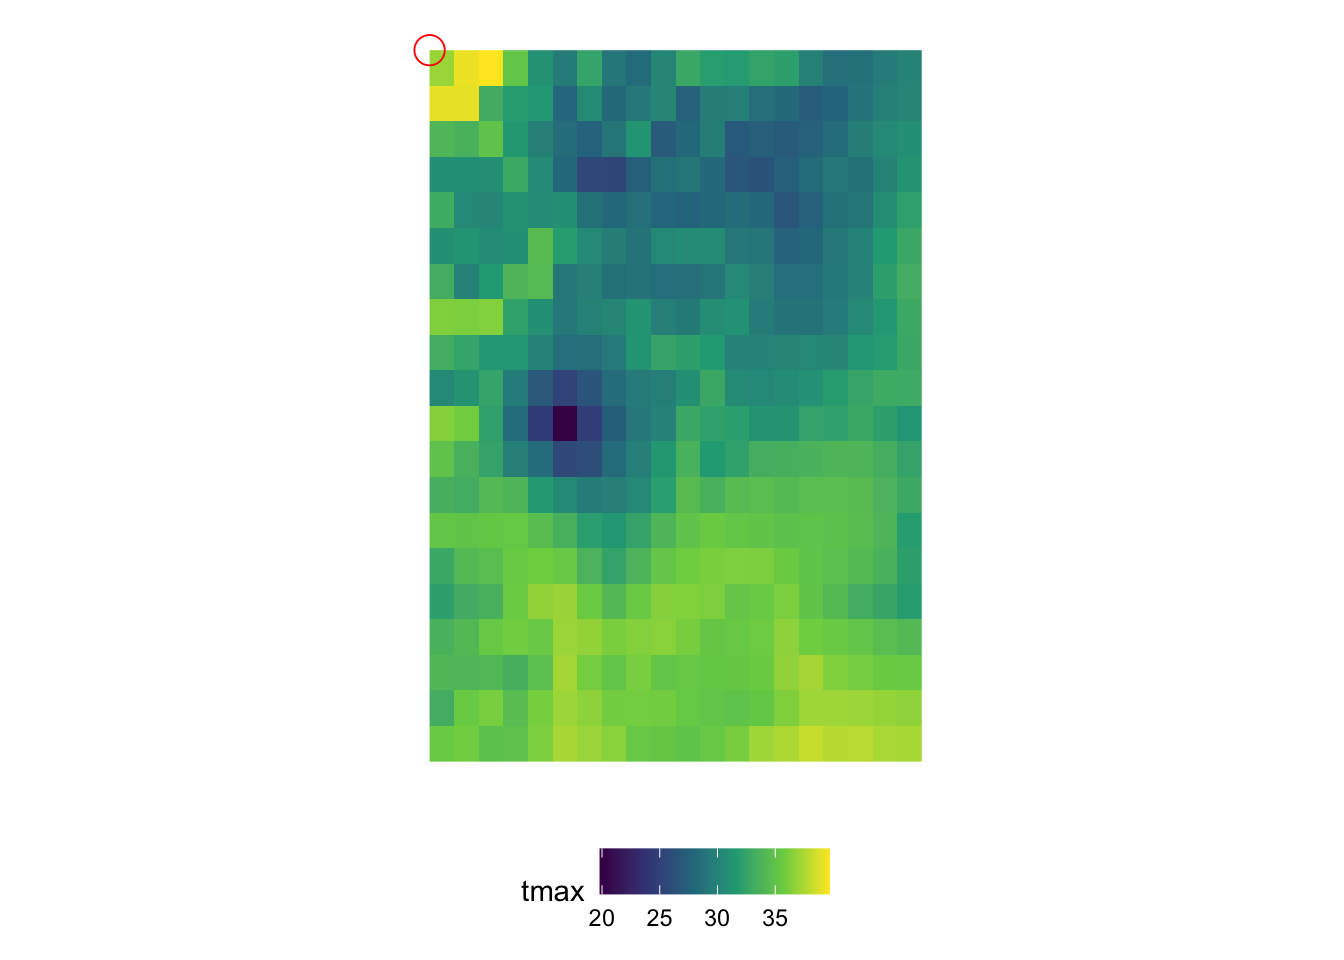
Figure 7.1: Map of tmax values on August 10, 2009: 20 by 20 matrix of cells
You can consider the 2D x-y surface as a matrix, where the location of a cell is defined by the row number and column number. Since the from for x is 1 and to for x is 20, we have 20 columns. Similarly, since the from for y is 1 and to for y is 20, we have 20 rows. The offset value of the x and y dimensions is the longitude and latitude of the upper-left corner point of the upper left cell of the 2D x-y surface, respectively (the red circle in Figure 7.1).80 As refsys indicates, they are in NAD83 GCS. The longitude of the upper-left corner point of all the cells in the \(j\)th column (from the left) of the 2D x-y surface is -121.7291667 + \((j-1)\times\) 0.0416667, where -121.7291667 is offset for x and 0.0416667 is delta for x. Similarly, the latitude of the upper-left corner point of all the cells in the \(i\)th row (from the top) of the 2D x-y surface is 46.6458333 +\((i-1)\times\) -0.0416667, where 46.6458333 is offset for y and -0.0416667 is delta for y.
The dimension characteristics of x and y are shared by all the layers across the date dimension, and a particular combination of x and y indexes refers to exactly the same location on the earth in all the layers across dates (of course). In the date dimension, we have 10 date values since the from for date is 1 and to for date is 10. The refsys of the date dimension is Date. Since the offset is 2009-08-11 and delta is 1, \(k\)th layer represents tmax values for August \(11+k-1\), 2009.
Putting all this information together, we have 20 by 20 x-y surfaces stacked over the date dimension (10 layers), thus making up a 20 by 20 by 10 three-dimensional array (or cube) as shown in the figure below (Figure 7.2).
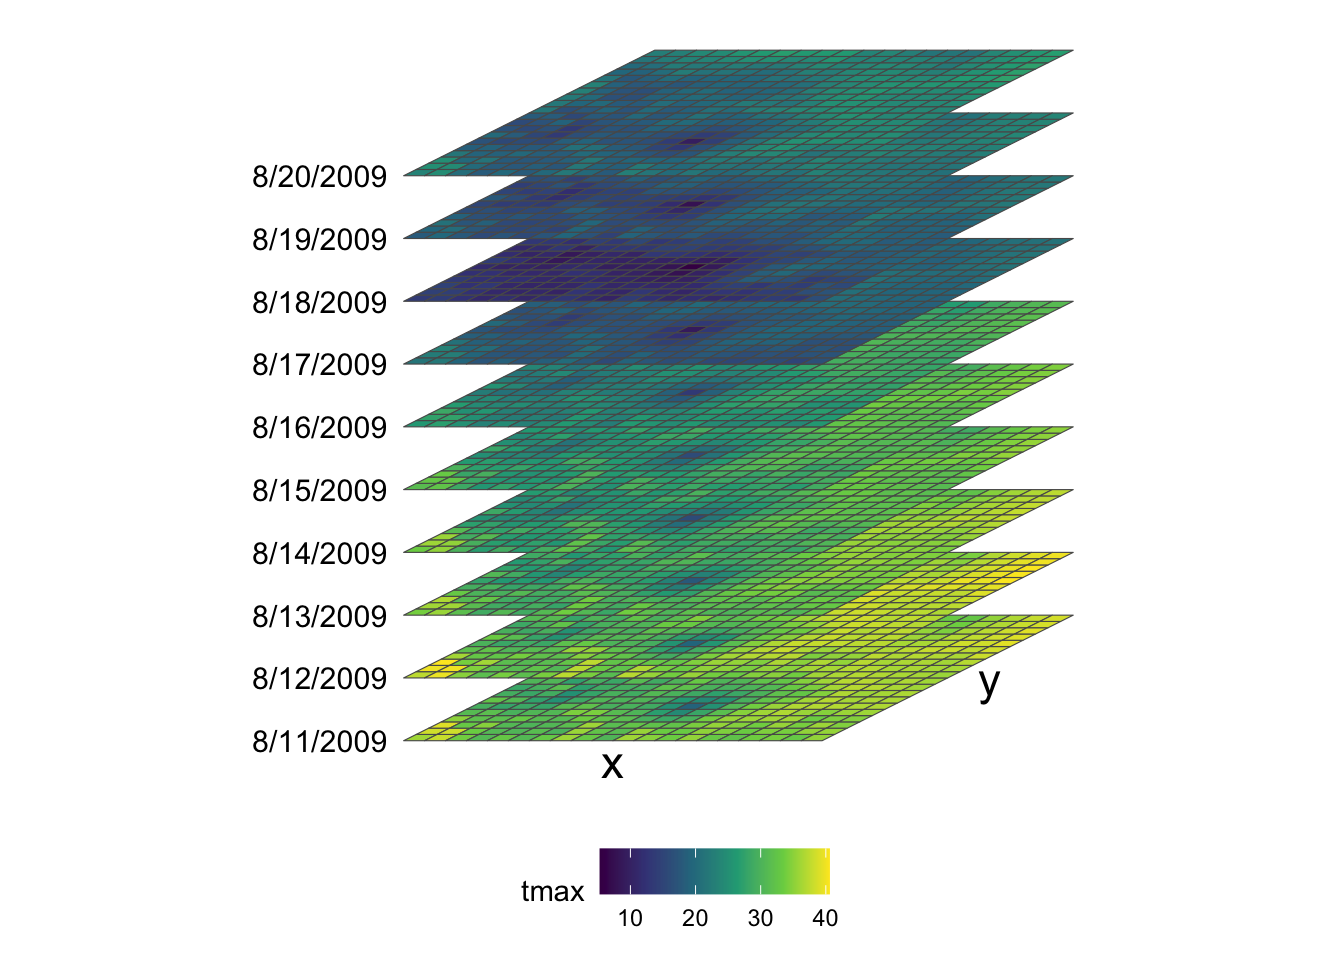
Figure 7.2: Visual illustration of stars data structure
Remember that prcp_tmax_PRISM_m8_y09 also has another attribute (ppt) which is structured exactly the same way as tmax. So, prcp_tmax_PRISM_m8_y09 basically has four dimensions: attribute, x, y, and date.
It is not guaranteed that all the dimensions are regularly spaced or timed. For an irregular dimension, dimension values themselves are stored in values instead of using indexes, offset, and delta to find dimension values. For example, if you observe satellite data with 6-day gaps sometimes and 7-day gaps other times, then the date dimension would be irregular. We will see a made-up example of irregular time dimension in Chapter 7.5.
It is not clear what it really means. I have never had to pay attention to this parameter. So, its definition is not explained here. If you insist on learning what it is the best resource is probably this↩︎
This changes depending on the
deltaofxandy. If both of thedeltaforxandyare positive, then theoffsetvalue of thexandydimensions are the longitude and latitude of the upper-left corner point of the lower-left cell of the 2D x-y surface.↩︎