9.1 USDA NASS QuickStat with tidyUSDA
There are several packages that lets you download data from the USDA NASS QuickStat. Here we use the tidyUSDA package (Lindblad 2020). A nice thing about tidyUSDA is that it gives you an option to download data as an sf object, which means you can immediately visualize the data or spatially interact it with other spatial objects.
First thing you want to do is to get an API key from this website, which you need to actually download data.
You can download data using getQuickstat(). There are number of options you can use to narrow down the scope of the data you are downloading including data_item, geographic_level, year, commodity, and so on. See its manual for the full list of parameters you can set. As an example, the code below download corn-related data by county in Illinois for year 2016 as an sf object.
(
IL_corn_yield <-
  getQuickstat(
    #--- put your API key in place of key_get() ---#
    key = key_get("usda_nass_qs_api"),
    program = "SURVEY",
    commodity = "CORN",
    geographic_level = "COUNTY",
    state = "ILLINOIS",
    year = "2016",
    geometry = TRUE
  )  %>%
  #--- keep only some of the variables ---#
  dplyr::select(
    year, county_name, county_code, state_name,
    state_fips_code, short_desc, Value
  )
)
Simple feature collection with 384 features and 7 fields (with 16 geometries empty)
Geometry type: MULTIPOLYGON
Dimension: XY
Bounding box: xmin: -91.51308 ymin: 36.9703 xmax: -87.01993 ymax: 42.50848
Geodetic CRS: NAD83
First 10 features:
year county_name county_code state_name state_fips_code short_desc
1 2016 BUREAU 011 ILLINOIS 17 CORN - ACRES PLANTED
2 2016 CARROLL 015 ILLINOIS 17 CORN - ACRES PLANTED
3 2016 HENRY 073 ILLINOIS 17 CORN - ACRES PLANTED
4 2016 JO DAVIESS 085 ILLINOIS 17 CORN - ACRES PLANTED
5 2016 LEE 103 ILLINOIS 17 CORN - ACRES PLANTED
6 2016 MERCER 131 ILLINOIS 17 CORN - ACRES PLANTED
7 2016 OGLE 141 ILLINOIS 17 CORN - ACRES PLANTED
8 2016 PUTNAM 155 ILLINOIS 17 CORN - ACRES PLANTED
9 2016 ROCK ISLAND 161 ILLINOIS 17 CORN - ACRES PLANTED
10 2016 STEPHENSON 177 ILLINOIS 17 CORN - ACRES PLANTED
Value geometry
1 273500 MULTIPOLYGON (((-89.85691 4...
2 147500 MULTIPOLYGON (((-90.16133 4...
3 235000 MULTIPOLYGON (((-90.43247 4...
4 100500 MULTIPOLYGON (((-90.50668 4...
5 258500 MULTIPOLYGON (((-89.63118 4...
6 142500 MULTIPOLYGON (((-90.99255 4...
7 228000 MULTIPOLYGON (((-89.68598 4...
8 37200 MULTIPOLYGON (((-89.33303 4...
9 65000 MULTIPOLYGON (((-90.33573 4...
10 179500 MULTIPOLYGON (((-89.92054 4...As you can see, it is an sf object with geometry column due to geometry = TRUE option. This means that you can immediately create a map with the data (Figure 9.1):
ggplot() +
  geom_sf(
    data = filter(IL_corn_yield, short_desc == "CORN, GRAIN - YIELD, MEASURED IN BU / ACRE"),
    aes(fill = Value)
  ) +
  theme_for_map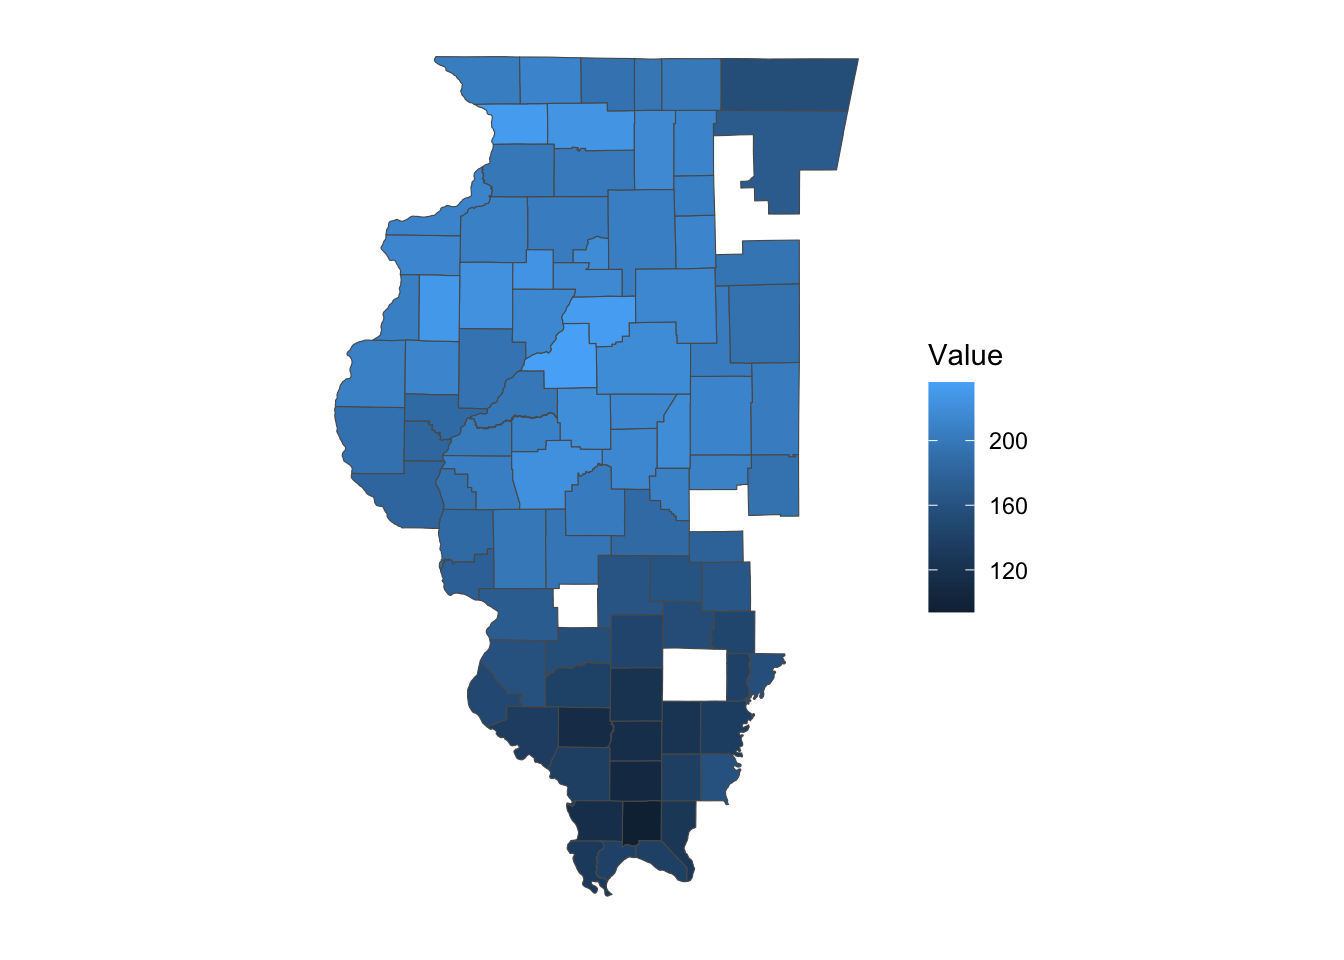
Figure 9.1: Corn Yield (bu/acre) in Illinois in 2016
You can download data for multiple states and years at the same time like below (if you want data for the whole U.S., don’t specify the state parameter).
(
IL_CO_NE_corn <-
  getQuickstat(
    key = key_get("usda_nass_qs_api"),
    program = "SURVEY",
    commodity = "CORN",
    geographic_level = "COUNTY",
    state = c("ILLINOIS", "COLORADO", "NEBRASKA"),
    year = paste(2014:2018),
    geometry = TRUE
  ) %>%
  #--- keep only some of the variables ---#
  dplyr::select(
    year, county_name, county_code, state_name,
    state_fips_code, short_desc, Value
  )
)
Simple feature collection with 6384 features and 7 fields (with 588 geometries empty)
Geometry type: MULTIPOLYGON
Dimension: XY
Bounding box: xmin: -109.0459 ymin: 36.9703 xmax: -87.01993 ymax: 43.00171
Geodetic CRS: NAD83
First 10 features:
year county_name county_code state_name state_fips_code short_desc
1 2017 BOULDER 013 COLORADO 08 CORN - ACRES PLANTED
2 2016 BOULDER 013 COLORADO 08 CORN - ACRES PLANTED
3 2016 LARIMER 069 COLORADO 08 CORN - ACRES PLANTED
4 2015 LARIMER 069 COLORADO 08 CORN - ACRES PLANTED
5 2014 LARIMER 069 COLORADO 08 CORN - ACRES PLANTED
6 2015 LOGAN 075 COLORADO 08 CORN - ACRES PLANTED
7 2014 LOGAN 075 COLORADO 08 CORN - ACRES PLANTED
8 2018 MORGAN 087 COLORADO 08 CORN - ACRES PLANTED
9 2017 MORGAN 087 COLORADO 08 CORN - ACRES PLANTED
10 2015 MORGAN 087 COLORADO 08 CORN - ACRES PLANTED
Value geometry
1 3000 MULTIPOLYGON (((-105.6486 4...
2 3300 MULTIPOLYGON (((-105.6486 4...
3 12800 MULTIPOLYGON (((-105.8225 4...
4 14900 MULTIPOLYGON (((-105.8225 4...
5 13600 MULTIPOLYGON (((-105.8225 4...
6 74500 MULTIPOLYGON (((-103.5737 4...
7 86100 MULTIPOLYGON (((-103.5737 4...
8 78300 MULTIPOLYGON (((-103.7148 4...
9 78200 MULTIPOLYGON (((-103.7148 4...
10 60200 MULTIPOLYGON (((-103.7148 4...9.1.1 Look for parameter values
This package has a function that lets you see all the possible parameter values you can use for many of these parameters. For example, suppose you know you would like irrigated corn yields in Colorado, but you are not sure what parameter value (string) you should supply to the data_item parameter. Then, you can do this:90
#--- get all the possible values for data_item ---#
all_items <- tidyUSDA::allDataItem

#--- take a look at the first six ---#
head(all_items)
short_desc1
"AG LAND - ACRES"
short_desc2
"AG LAND - NUMBER OF OPERATIONS"
short_desc3
"AG LAND - OPERATIONS WITH TREATED"
short_desc4
"AG LAND - TREATED, MEASURED IN ACRES"
short_desc5
"AG LAND, (EXCL CROPLAND & PASTURELAND & WOODLAND) - ACRES"
short_desc6
"AG LAND, (EXCL CROPLAND & PASTURELAND & WOODLAND) - AREA, MEASURED IN PCT OF AG LAND" You can use key words like “CORN,” “YIELD,” “IRRIGATED” to narrow the entire list using grep()91:
all_items %>%
  grep(pattern = "CORN", ., value = TRUE) %>%
  grep(pattern = "YIELD", ., value = TRUE) %>%
  grep(pattern = "IRRIGATED", ., value = TRUE)
short_desc9227
"CORN, GRAIN, IRRIGATED - YIELD, MEASURED IN BU / ACRE"
short_desc9228
"CORN, GRAIN, IRRIGATED - YIELD, MEASURED IN BU / NET PLANTED ACRE"
short_desc9233
"CORN, GRAIN, IRRIGATED, ENTIRE CROP - YIELD, MEASURED IN BU / ACRE"
short_desc9236
"CORN, GRAIN, IRRIGATED, NONE OF CROP - YIELD, MEASURED IN BU / ACRE"
short_desc9238
"CORN, GRAIN, IRRIGATED, PART OF CROP - YIELD, MEASURED IN BU / ACRE"
short_desc9249
"CORN, GRAIN, NON-IRRIGATED - YIELD, MEASURED IN BU / ACRE"
short_desc9250
"CORN, GRAIN, NON-IRRIGATED - YIELD, MEASURED IN BU / NET PLANTED ACRE"
short_desc9291
"CORN, SILAGE, IRRIGATED - YIELD, MEASURED IN TONS / ACRE"
short_desc9296
"CORN, SILAGE, IRRIGATED, ENTIRE CROP - YIELD, MEASURED IN TONS / ACRE"
short_desc9299
"CORN, SILAGE, IRRIGATED, NONE OF CROP - YIELD, MEASURED IN TONS / ACRE"
short_desc9301
"CORN, SILAGE, IRRIGATED, PART OF CROP - YIELD, MEASURED IN TONS / ACRE"
short_desc9307
"CORN, SILAGE, NON-IRRIGATED - YIELD, MEASURED IN TONS / ACRE"
short_desc28557
"SWEET CORN, IRRIGATED - YIELD, MEASURED IN CWT / ACRE"
short_desc28564
"SWEET CORN, NON-IRRIGATED - YIELD, MEASURED IN CWT / ACRE" Looking at the list, we know the exact text value we want, which is the first entry of the vector.
(
CO_ir_corn_yield <-
  getQuickstat(
    key = key_get("usda_nass_qs_api"),
    program = "SURVEY",
    data_item = "CORN, GRAIN, IRRIGATED - YIELD, MEASURED IN BU / ACRE",
    geographic_level = "COUNTY",
    state = "COLORADO",
    year = "2018",
    geometry = TRUE
  ) %>%
  #--- keep only some of the variables ---#
  dplyr::select(year, NAME, county_code, short_desc, Value)
)
Here is the complete list of functions that gives you the possible values of the parameters for getQuickstat().
tidyUSDA::allCategory
tidyUSDA::allSector
tidyUSDA::allGroup
tidyUSDA::allCommodity
tidyUSDA::allDomain
tidyUSDA::allCounty
tidyUSDA::allProgram
tidyUSDA::allDataItem
tidyUSDA::allState
tidyUSDA::allGeogLevel
9.1.2 Caveats
You cannot retrieve more than \(50,000\) (the limit is set by QuickStat) rows of data. The query below requests much more than \(50,000\) observations, and fail. In this case, you need to narrow the search and chop the task into smaller tasks.
many_states_corn <- getQuickstat(
    key = key_get("usda_nass_qs_api"),
    program = "SURVEY",
    commodity = "CORN",
    geographic_level = "COUNTY",
    state = c("ILLINOIS", "COLORADO", "NEBRASKA", "IOWA", "KANSAS"),
    year = paste(1995:2018),
    geometry = TRUE
  )
Error in UseMethod("left_join"): no applicable method for 'left_join' applied to an object of class "list"Another caveat is that the query returns an error when there is no observation that satisfy your query criteria. For example, even though “CORN, GRAIN, IRRIGATED - YIELD, MEASURED IN BU / ACRE” is one of the values you can use for data_item, there is no entry for the statistic in Illinois in 2018. Therefore, the following query fails.
many_states_corn <-
  getQuickstat(
    key = key_get("usda_nass_qs_api"),
    program = "SURVEY",
    data_item = "CORN, GRAIN, IRRIGATED - YIELD, MEASURED IN BU / ACRE",
    geographic_level = "COUNTY",
    state = "ILLINOIS",
    year = "2018",
    geometry = TRUE
  )
Error in UseMethod("left_join"): no applicable method for 'left_join' applied to an object of class "list"