4.5 Quick plot and interactive map
To have a quick visualization of the data values of SpatRaster objects, you can simply use plot():
plot(IA_cdl_2015_sr)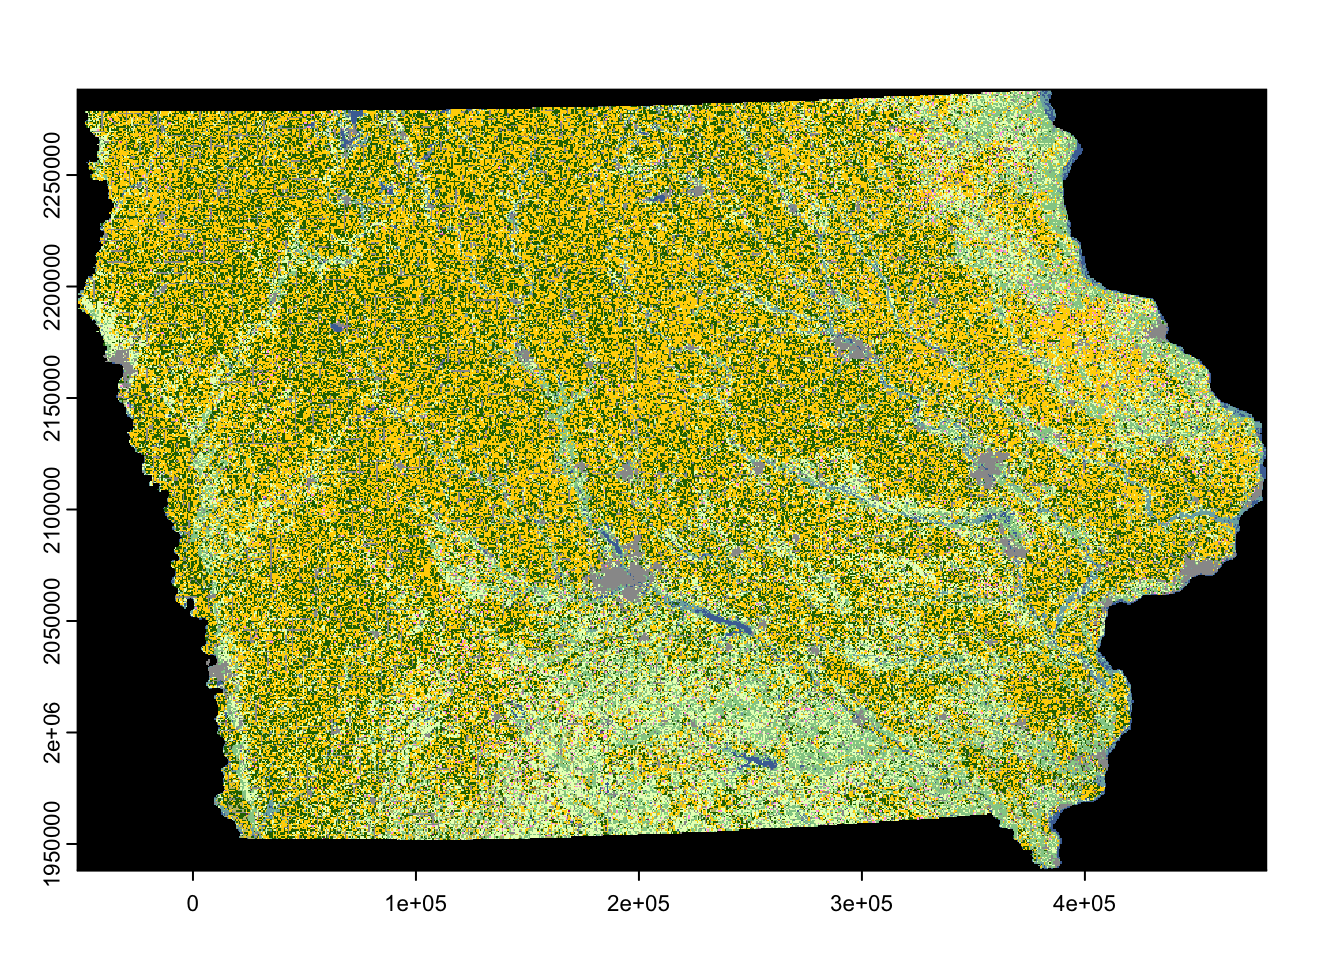
If you would like to have an interactive view of raster datasets, you can use the tmap_leaflet() function from the tmap package just like we did for sf objects in Chapter 3. It still does not support terra objects, so you first need to convert a SpatRaster object into Raster\(^*\) objects first.
tmap_leaflet(
  tm_shape(as(IA_cdl_2015_sr, "Raster")) + # what sf to use for creating a map
  tm_raster() # what type of geometry to put on the map
)
By clicking on the white box beneath the \(+\) and \(-\) signs, you can pick the layers to display (here, CDL for Iowa in 2015 and 2016). Note that, in the map above, the raster values are modified because the number of cells of the raster layers are too large. mapView() reduced the resolution when creating the map, changing the values during the process. You can specify the maximum number of cells using the mapview.maxpixels option.