7.7 Merging stars objects using c() and st_mosaic()
7.7.1 Merging stars objects along the third dimension (band)
Here we learn how to merge multiple stars objects that have
- the same attributes
- the same spatial extent and resolution
- different bands (dates here)
For example, consider merging PRISM precipitation data in January and February. Both of them have exactly the same spatial extent and resolutions and represent the same attribute (precipitation). However, they differ in the third dimension (date). So, you are trying to stack data of the same attributes along the third dimension (date) while making sure that spatial correspondence is maintained. This merge is kind of like rbind() that stacks multiple data.frames vertically while making sure the variables are aligned correctly.
Let’s import the PRISM precipitation data for February, 2009.
#--- read the February ppt data ---#
(
ppt_m2_y09_stars <- read_stars("Data/PRISM_ppt_y2009_m2.tif")
)
stars object with 3 dimensions and 1 attribute
attribute(s), summary of first 1e+05 cells:
PRISM_ppt_y2009_m2.tif
Min. : 0.00
1st Qu.: 0.00
Median : 0.00
Mean : 0.19
3rd Qu.: 0.00
Max. :11.63
NA's :60401
dimension(s):
from to offset delta refsys point values
x 1 1405 -125.021 0.0416667 NAD83 FALSE NULL [x]
y 1 621 49.9375 -0.0416667 NAD83 FALSE NULL [y]
band 1 28 NA NA NA NA NULL Note here that the third dimension of ppt_m2_y09_stars has not been changed to date.
Now, let’s try to merge the two:
#--- combine the two ---#
(
ppt_m1_to_m2_y09_stars <- c(ppt_m1_y09_stars, ppt_m2_y09_stars, along = 3)
)
stars object with 3 dimensions and 1 attribute
attribute(s), summary of first 1e+05 cells:
PRISM_ppt_y2009_m1.tif
Min. : 0.00
1st Qu.: 0.00
Median : 0.44
Mean : 3.54
3rd Qu.: 3.49
Max. :56.21
NA's :60401
dimension(s):
from to offset delta refsys point values
x 1 1405 -125.021 0.0416667 NAD83 FALSE NULL [x]
y 1 621 49.9375 -0.0416667 NAD83 FALSE NULL [y]
date 1 59 2009-01-01 1 days Date NA NULL As you noticed, the second object (ppt_m2_y09_stars) was assumed to have the same date characteristics as the first one: the data in February is observed daily (delta is 1 day). This causes no problem in this instance as the February data is indeed observed daily starting from 2009-02-01. However, be careful if you are appending the data that does not start from 1 day after (or more generally delta for the time dimension) the first data or the data that does not follow the same observation interval.
For this reason, it is advisable to first set the date values if it has not been set. Pretend that the February data actually starts from 2009-02-02 to 2009-03-01 to see what happens when the regular interval (delta) is not kept after merging.
#--- starting date ---#
start_date <- ymd("2009-02-01")

#--- ending date ---#
end_date <- ymd("2009-02-28")

#--- sequence of dates  ---#
dates_ls <- seq(start_date, end_date, "days")

#--- pretend the data actually starts from `2009-02-02` to `2009-03-01` ---#
(
ppt_m2_y09_stars <- st_set_dimensions(ppt_m2_y09_stars, 3, values = c(dates_ls[-1], ymd("2009-03-01")), name = "date")
)
stars object with 3 dimensions and 1 attribute
attribute(s), summary of first 1e+05 cells:
PRISM_ppt_y2009_m2.tif
Min. : 0.00
1st Qu.: 0.00
Median : 0.00
Mean : 0.19
3rd Qu.: 0.00
Max. :11.63
NA's :60401
dimension(s):
from to offset delta refsys point values
x 1 1405 -125.021 0.0416667 NAD83 FALSE NULL [x]
y 1 621 49.9375 -0.0416667 NAD83 FALSE NULL [y]
date 1 28 2009-02-02 1 days Date NA NULL If you merge the two,
c(ppt_m1_y09_stars, ppt_m2_y09_stars, along = 3)stars object with 3 dimensions and 1 attribute
attribute(s), summary of first 1e+05 cells:
PRISM_ppt_y2009_m1.tif
Min. : 0.00
1st Qu.: 0.00
Median : 0.44
Mean : 3.54
3rd Qu.: 3.49
Max. :56.21
NA's :60401
dimension(s):
from to offset delta refsys point values
x 1 1405 -125.021 0.0416667 NAD83 FALSE NULL [x]
y 1 621 49.9375 -0.0416667 NAD83 FALSE NULL [y]
date 1 59 NA NA Date NA 2009-01-01,...,2009-03-01 The date dimension does not have delta any more, and correctly so because there is a one-day gap between the end date of the first stars object (“2009-01-31”) and the start date of the second stars object (“2009-02-02”). So, all the date values are now stored in values.
7.7.2 Merging stars objects of different attributes
Here we learn how to merge multiple stars objects that have
- different attributes
- the same spatial extent and resolution
- the same bands (dates here)
For example, consider merging PRISM precipitation and tmax data in January. Both of them have exactly the same spatial extent and resolutions and the date characteristics (starting and ending on the same dates with the same time interval). However, they differ in what they represent: precipitation and tmax. This merge is kind of like cbind() that combines multiple data.frames of different variables while making sure the observation correspondence is correct.
Let’s read the daily tmax data for January, 2009:
(
tmax_m1_y09_stars <- read_stars("Data/PRISM_tmax_y2009_m1.tif") %>%
    #--- change the attribute name ---#
    setNames("tmax")
)
stars object with 3 dimensions and 1 attribute
attribute(s), summary of first 1e+05 cells:
tmax
Min. :-17.90
1st Qu.: -7.76
Median : -2.25
Mean : -3.06
3rd Qu.: 1.72
Max. : 7.99
NA's :60401
dimension(s):
from to offset delta refsys point values
x 1 1405 -125.021 0.0416667 NAD83 FALSE NULL [x]
y 1 621 49.9375 -0.0416667 NAD83 FALSE NULL [y]
band 1 31 NA NA NA NA NULL Now, let’s merge the PRISM ppt and tmax data in January, 2009.
c(ppt_m1_y09_stars, tmax_m1_y09_stars)Error in c.stars(ppt_m1_y09_stars, tmax_m1_y09_stars): don't know how to merge arrays: please specify parameter alongOops. Well, the problem is that the third dimension of the two objects is not the same. Even though we know that the xth element of their third dimension represent the same thing, they look different to R’s eyes. So, we first need to change the third dimension of tmax_m1_y09_stars to be consistent with the third dimension of ppt_m1_y09_stars (dates_ls_m1 was defined in Chapter 7.5).
(
tmax_m1_y09_stars <- st_set_dimensions(tmax_m1_y09_stars, 3, values = dates_ls_m1, names = "date")
)
stars object with 3 dimensions and 1 attribute
attribute(s), summary of first 1e+05 cells:
tmax
Min. :-17.90
1st Qu.: -7.76
Median : -2.25
Mean : -3.06
3rd Qu.: 1.72
Max. : 7.99
NA's :60401
dimension(s):
from to offset delta refsys point values
x 1 1405 -125.021 0.0416667 NAD83 FALSE NULL [x]
y 1 621 49.9375 -0.0416667 NAD83 FALSE NULL [y]
date 1 31 2009-01-01 1 days Date NA NULL Now, we can merge the two.
(
ppt_tmax_m1_y09_stars <- c(ppt_m1_y09_stars, tmax_m1_y09_stars)
)
stars object with 3 dimensions and 2 attributes
attribute(s), summary of first 1e+05 cells:
PRISM_ppt_y2009_m1.tif tmax
Min. : 0.00 Min. :-17.90
1st Qu.: 0.00 1st Qu.: -7.76
Median : 0.44 Median : -2.25
Mean : 3.54 Mean : -3.06
3rd Qu.: 3.49 3rd Qu.: 1.72
Max. :56.21 Max. : 7.99
NA's :60401 NA's :60401
dimension(s):
from to offset delta refsys point values
x 1 1405 -125.021 0.0416667 NAD83 FALSE NULL [x]
y 1 621 49.9375 -0.0416667 NAD83 FALSE NULL [y]
date 1 31 2009-01-01 1 days Date NA NULL As you can see, now we have another attribute called tmax.
7.7.3 Merging stars objects of different spatial extents
Here we learn how to merge multiple stars objects that have
- the same attributes
- different spatial extent but same resolution86
- the same bands (dates here)
Some times you have multiple separate raster datasets that have different spatial coverages and would like to combine them into one. You can do that using st_mosaic().
Let’s split tmax_m1_y09_stars into two parts:
tmax_1 <- filter(tmax_m1_y09_stars, x <= -100)
tmax_2 <- filter(tmax_m1_y09_stars, x > -100)
Here (Figure 7.3) is what they look like (only Jan 1, 1980):
g_1 <- ggplot() +
  geom_stars(data = tmax_1[,,,1]) +
  theme_for_map +
  theme(
    legend.position = "bottom"
  )

g_2 <- ggplot() +
  geom_stars(data = tmax_2[,,,1]) +
  theme_for_map +
  theme(
    legend.position = "bottom"
  )

library(patchwork)
g_1 + g_2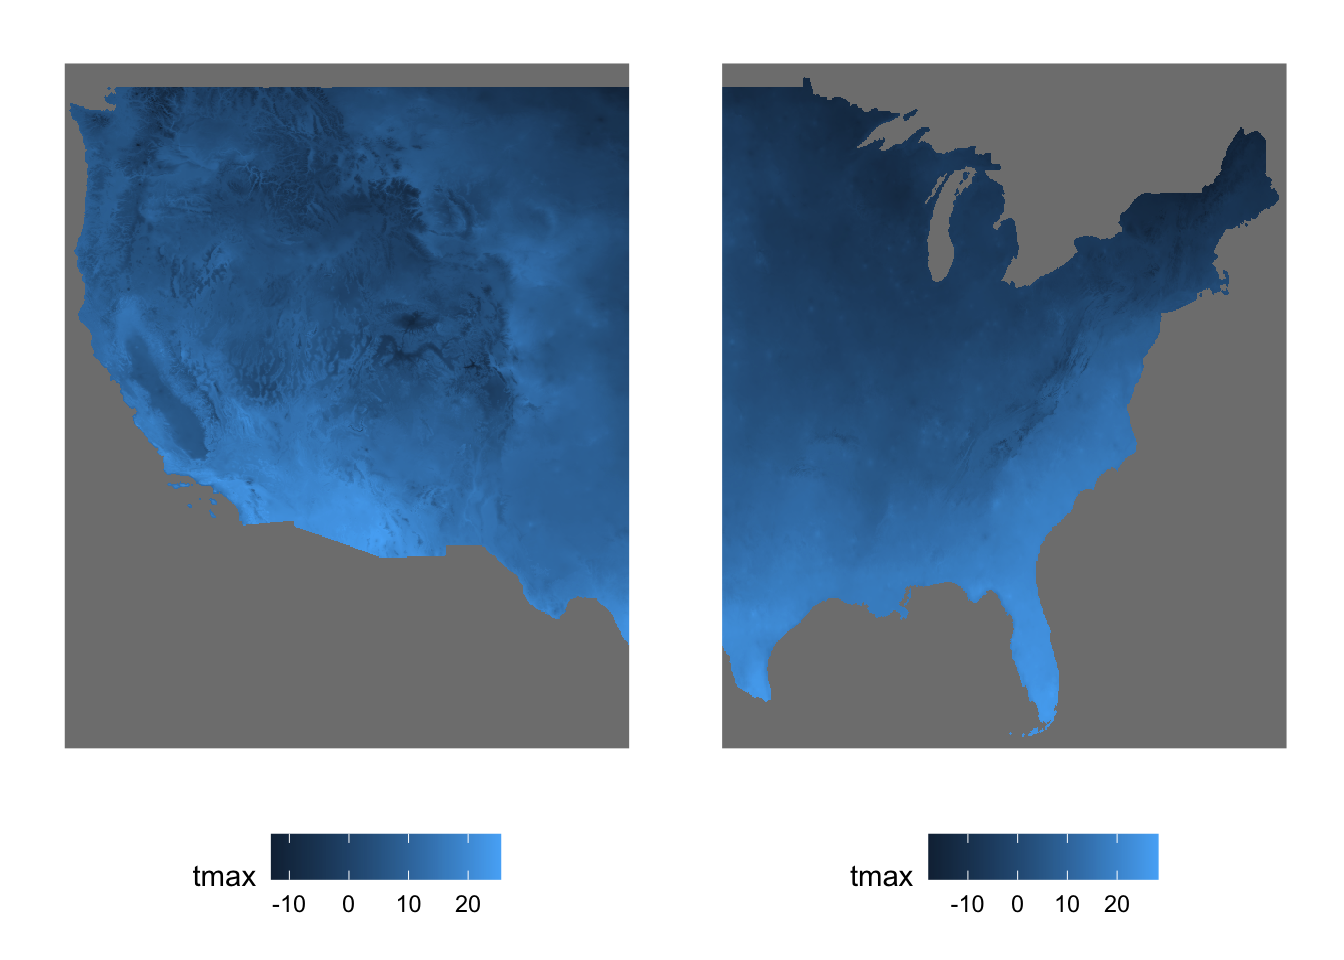
Figure 7.3: Two spatially non-overlapping stars objects
Let’s combine the two using st_mosaic():
tmax_combined <- st_mosaic(tmax_1, tmax_2) Here is what the combined object looks like (Figure 7.4)
ggplot() +
  geom_stars(data = tmax_combined[,,,1]) +
theme_for_map 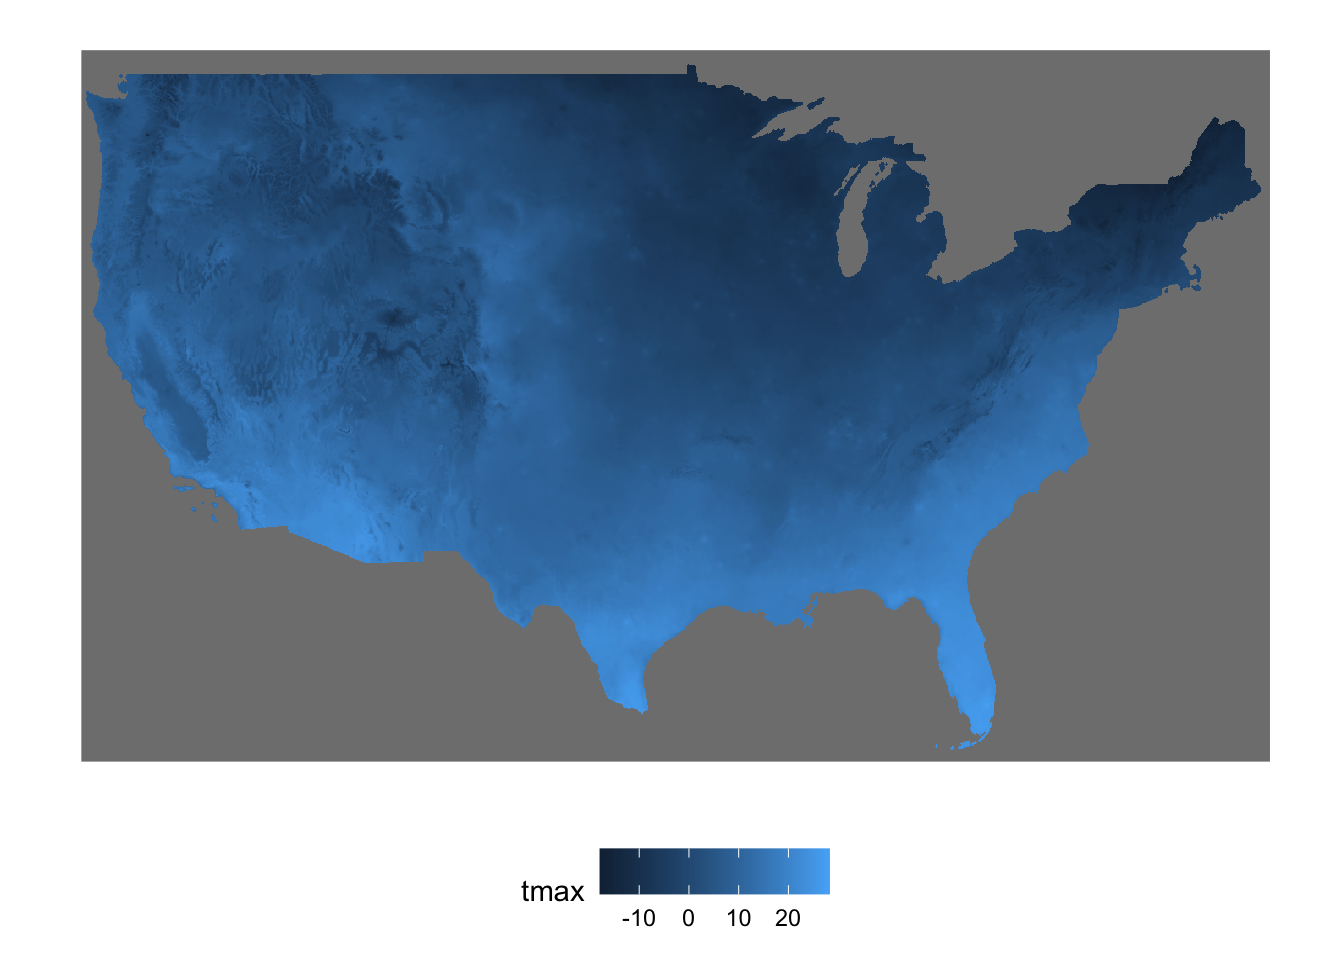
Figure 7.4: Map of the stars objects combined into one
It is okay to have the two stars objects to be combined have a spatial overlap. The following split creates two stars objects with a spatial overlap.
tmax_1 <- filter(tmax_m1_y09_stars, x <= -100)
tmax_2 <- filter(tmax_m1_y09_stars, x > -110)
Here (Figure 7.5) is what they look like (only Jan 1, 1980):
g_1 <- ggplot() +
  geom_stars(data = tmax_m1_y09_stars[,,,1], fill = NA) +
  geom_stars(data = tmax_1[,,,1]) +
  theme_for_map

g_2 <- ggplot() +
  geom_stars(data = tmax_m1_y09_stars[,,,1], fill = NA) +
  geom_stars(data = tmax_2[,,,1]) +
  theme_for_map

library(patchwork)
g_1 / g_2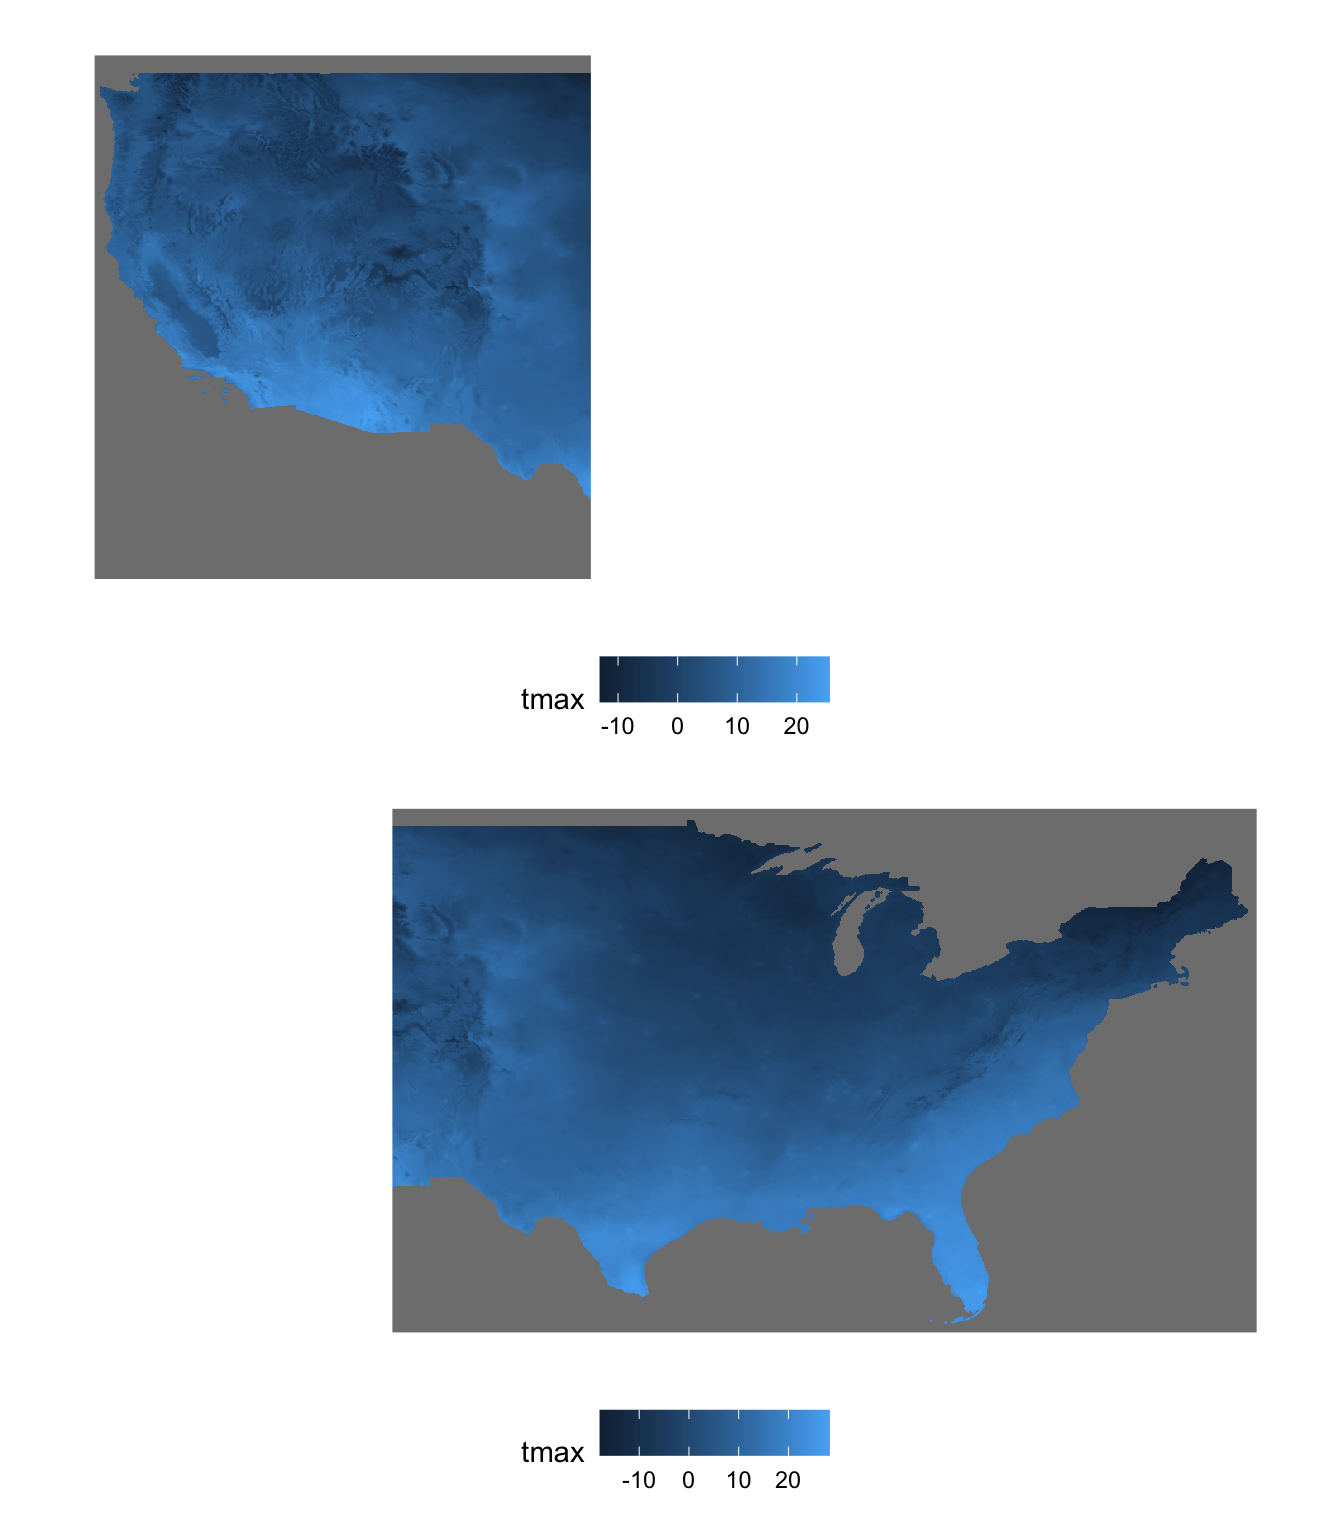
Figure 7.5: Two spatially overlapping stars objects
As you can see below, st_mosaic() reconciles the spatial overlap between the two stars objects.
(
tmax_combined <- st_mosaic(tmax_1, tmax_2)
)
stars object with 3 dimensions and 1 attribute
attribute(s), summary of first 1e+05 cells:
tmax
Min. :-17.90
1st Qu.: -7.76
Median : -2.25
Mean : -3.06
3rd Qu.: 1.72
Max. : 7.99
NA's :60401
dimension(s):
from to offset delta refsys point values
x 1 1405 -125.021 0.0416667 NAD83 NA NULL [x]
y 1 621 49.9375 -0.0416667 NAD83 NA NULL [y]
band 1 31 NA NA NA NA NULL Here is the plot (Figure 7.6):
ggplot() +
  geom_stars(data = tmax_combined[,,,1]) +
  theme_for_map
Figure 7.6: Map of the spatially-overlapping stars objects combined into one
Technically, you can actually merge
starsobjects of different spatial resolutions. But, you probably should not.↩︎