2.5 Interactive view of an sf object
Sometimes it is useful to be able to tell where certain spatial objects are and what values are associated with them on a map. The mapView() function from the mapview package can create an interactive map where you can point to a spatial object and the associated information is revealed on the map. Let’s use the North Carolina county map as an example here:
#--- read the NC county map data ---#
nc <- st_read(system.file("shape/nc.shp", package="sf"))

#--- generate an interactive map ---#
mapView(nc)
As you can see, if you put your cursor on a polygon (county) and click on it, then its information pops up.
You can be selective in variables to be mapped and make the individual map layers for the selected variables using the zcol option. The following code picks AREA and PERIMETER variables.
For the zcol option to work, you need to install the development version of the mapview package using the following code (as of 06/04/2020).
By clicking on the white box51 beneath the \(+\) and \(-\) signs, you can pick the layers to display.
The mapview package also supports spatial object classes defined by the raster package as we will see in Chapter 4. There is much more you can do with this package. Interested readers are directed to its package website.52 The tmap package is also capable of creating an interactive map as we will see in Chapter 8. The mapview package is introduced here because it is extremely easier to use and is sufficient for exploratory purposes.
Alternatively, you could use the tmap package to create interactive maps. You can first create a static map following a syntax like this:
#--- NOT RUN (for polygons) ---#
tm_shape(sf) +
  tm_polygons()

#--- NOT RUN (for points) ---#
tm_shape(sf) +
  tm_symbols()
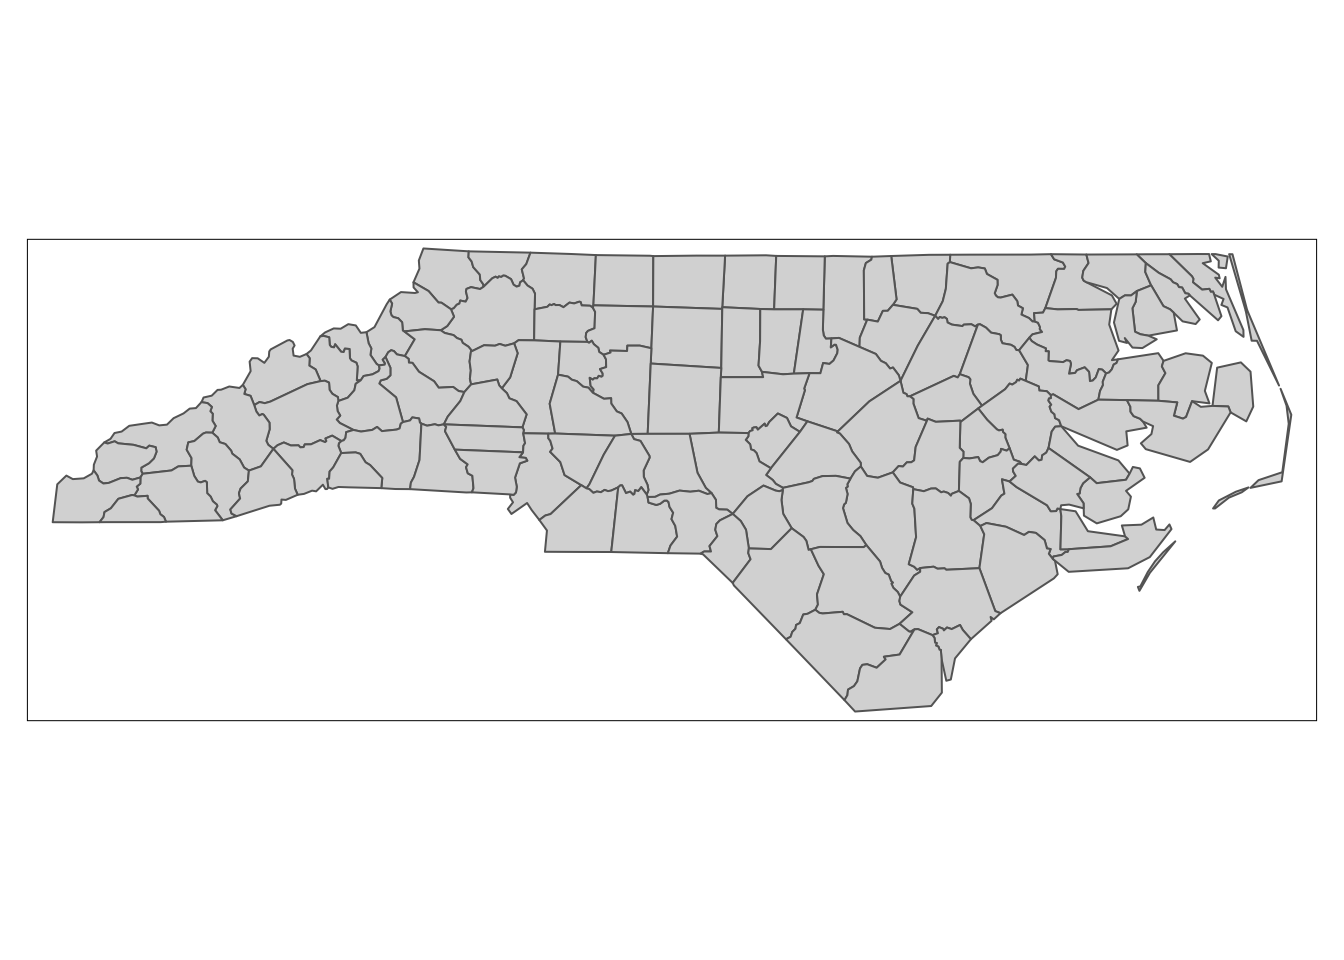
This creates a static map of nc where county boundaries are drawn:

Then, you can apply tmap_leaflet() to the static map to have an interactive view of the map:
You could also change the view mode of tmap objects to the view mode using tmap_mode("view") and then simply evaluate tm_nc_polygons.
#--- change to the "view" mode ---#
tmap_mode("view")

#--- now you have an interactive biew ---#
tm_nc_polygons
Note that once you change the view mode to “view”, then the evaluation of all tmap objects become interactive. I prefer the first option, as I need to revert the view mode back to “plot” by tmap_mode("plot") if I don’t want interactive views.
You should see a stack of sheets on your RStudio instead of just a which box. For some unknown reasons, they do not show up in the documents generated by Rmarkdown.↩︎
However, for economists looking to publish in economics journals, the additional controls on interactive maps are not really useful as no economics journals support interactive maps for publication anyway.↩︎